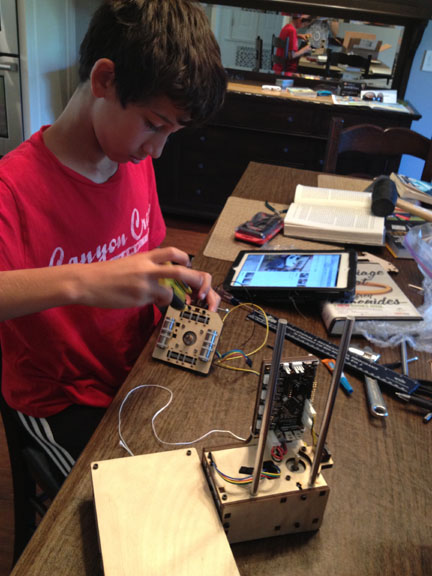
I think I’m not alone in feeling anxious about this election season. My favorite distraction has always been to throw myself into making, so I decided to channel my politically-driven anxiety into a new project. Since I find myself repeatedly checking the polling aggregator site FiveThirtyEight for the election odds, this new project is a constantly updating display for the current polling statistics.
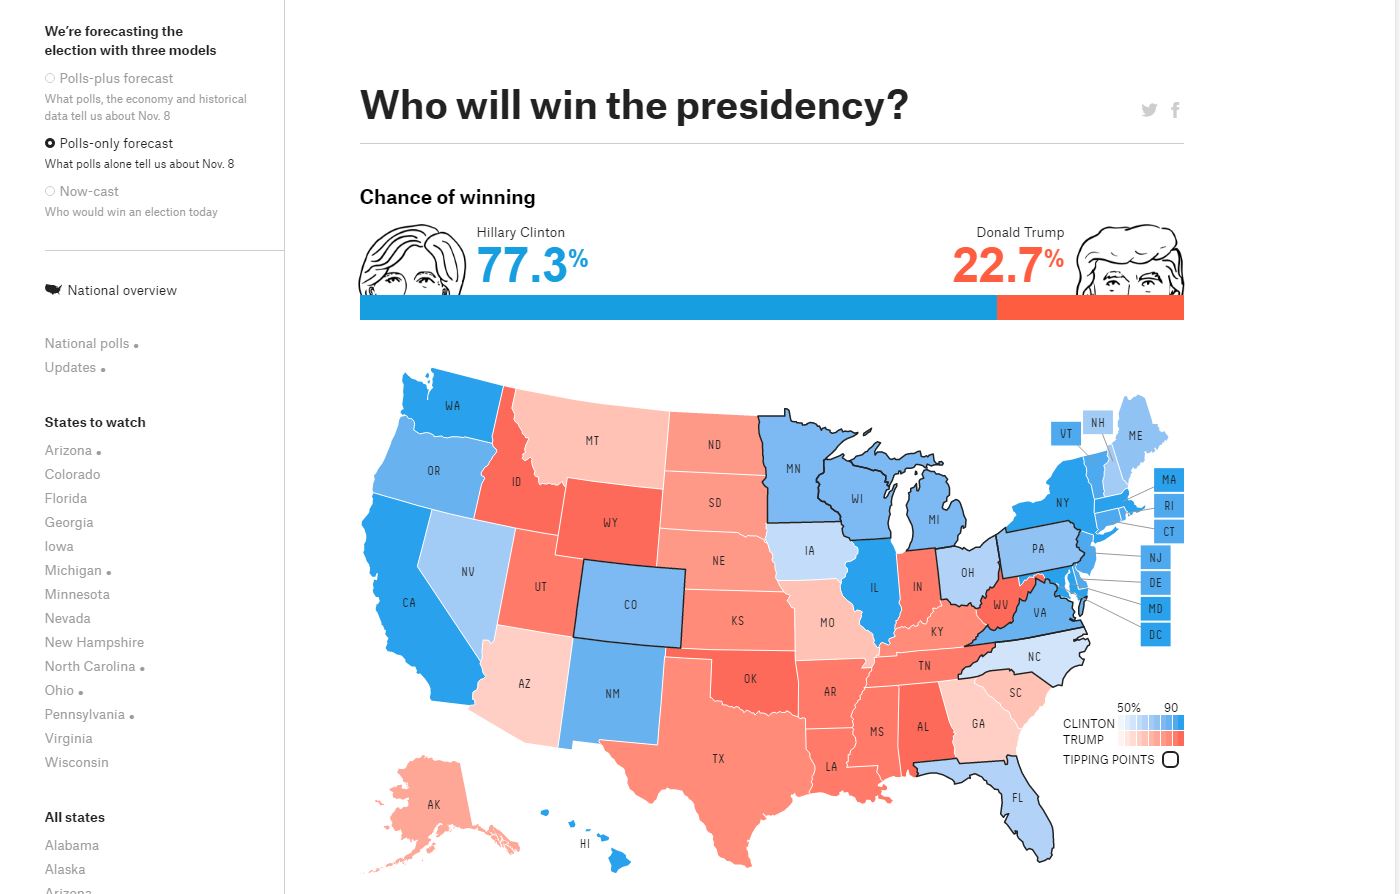
The specific statistic in question is FiveThirtyEight’s polls-only prediction of the race outcome – shown above, and accessible here.
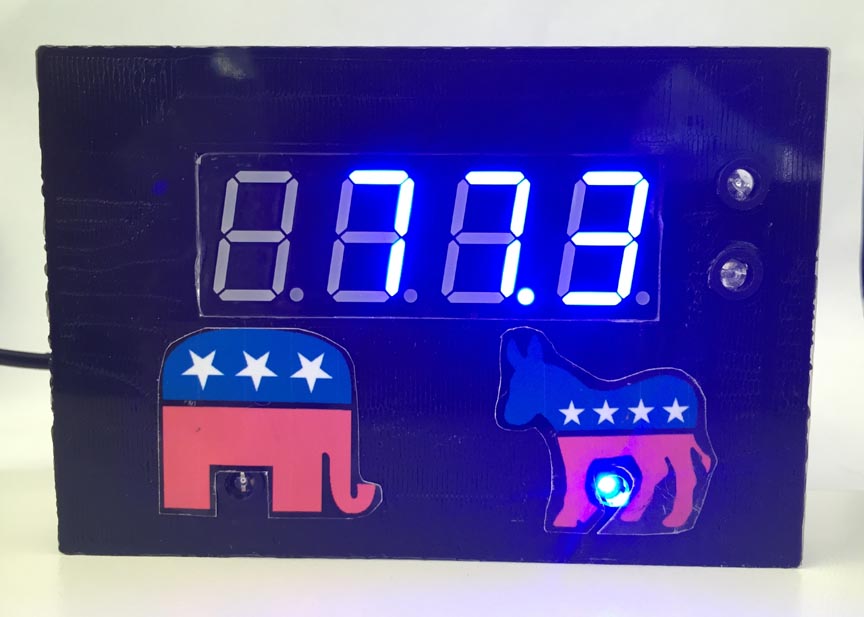
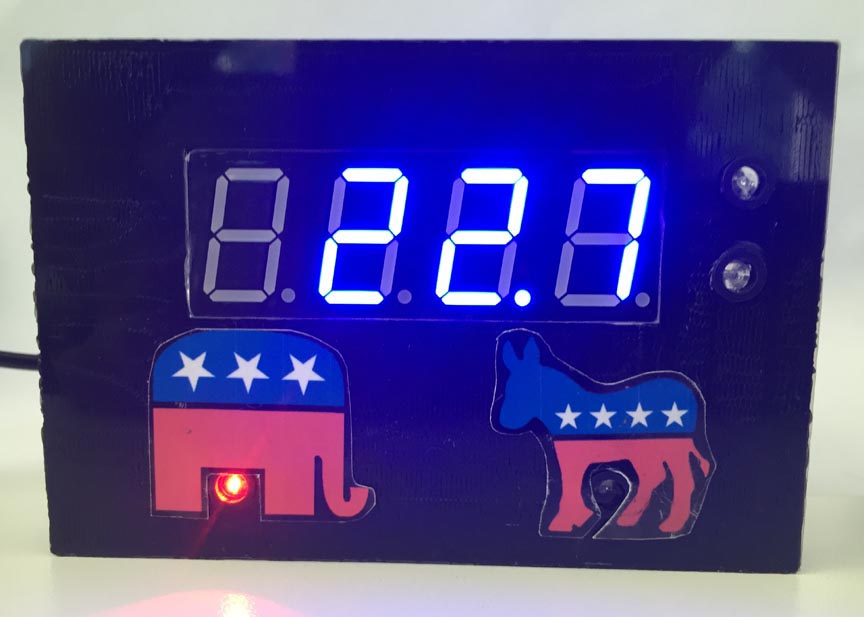
The Display
The Apocalyptometer displays the percentage chance, per polling data from FiveThirtyEight.com, of either party winning the November presidential election. There is a switch in the back to set the display for the Democratic or Republican candidate, depending on your preference. The two LEDs on the bottom indicate which party is being displayed at the moment. There are two lights just to the right of the 7-segment LED readout as well. These indicate whether the most recent change in percentage was up (green) or down (yellow), though they don’t kick in until the first change in the display.
Hardware
Electronics:
- Adafruit Huzzah ESP8266 Breakout Board
- Logic Level Converter
- Sparkfun 20 mm 4-digit 7-segment Display
- (4) 5mm LEDs
- (4) 5mm LED mounting holders
- (4) 220 Ω resistors
- Slide switch
- (1) 10 K Ω resistor
- Breadboard and wires
- 6V 1A Wall Adapter (5V would probably work fine as well)
- USB to TTL Serial Cable (for programming the Huzzah)
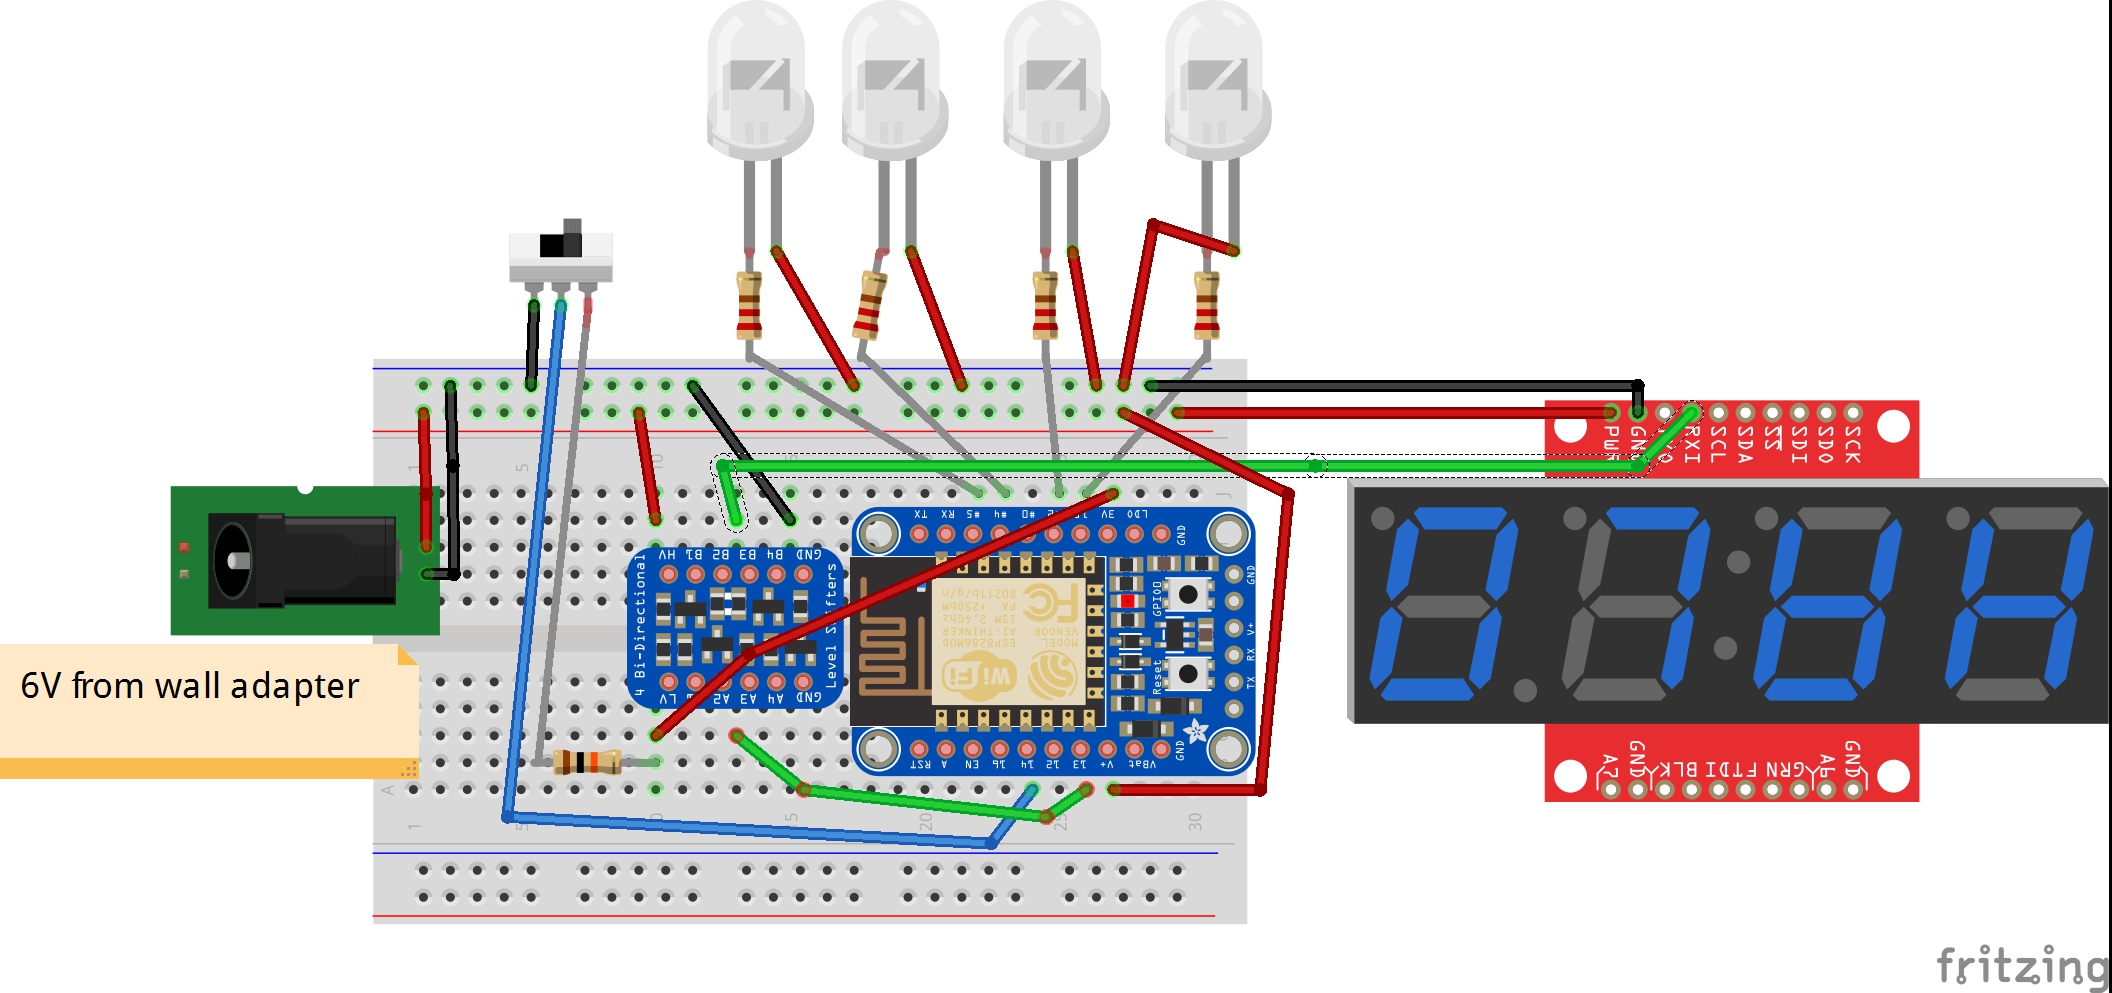
I chose the Adafruit Huzzah board to drive this project because it combines simple WiFi access usingthe ESP8266 with Arduino IDE compatibility and enough I/O pins to run the LEDs, switch and 7-segment display. Additionally, it’s inexpensive and Adafruit provides some nice libraries and code examples to show how to use various protocols to access data over the Internet.
The logic level converter was necessary because the Huzzah operates at 3.3V and the 7-Segment display operates at 5V. Sometimes, you can trigger 5V logic with a lower voltage input, but I found the display wouldn’t work without the converter.
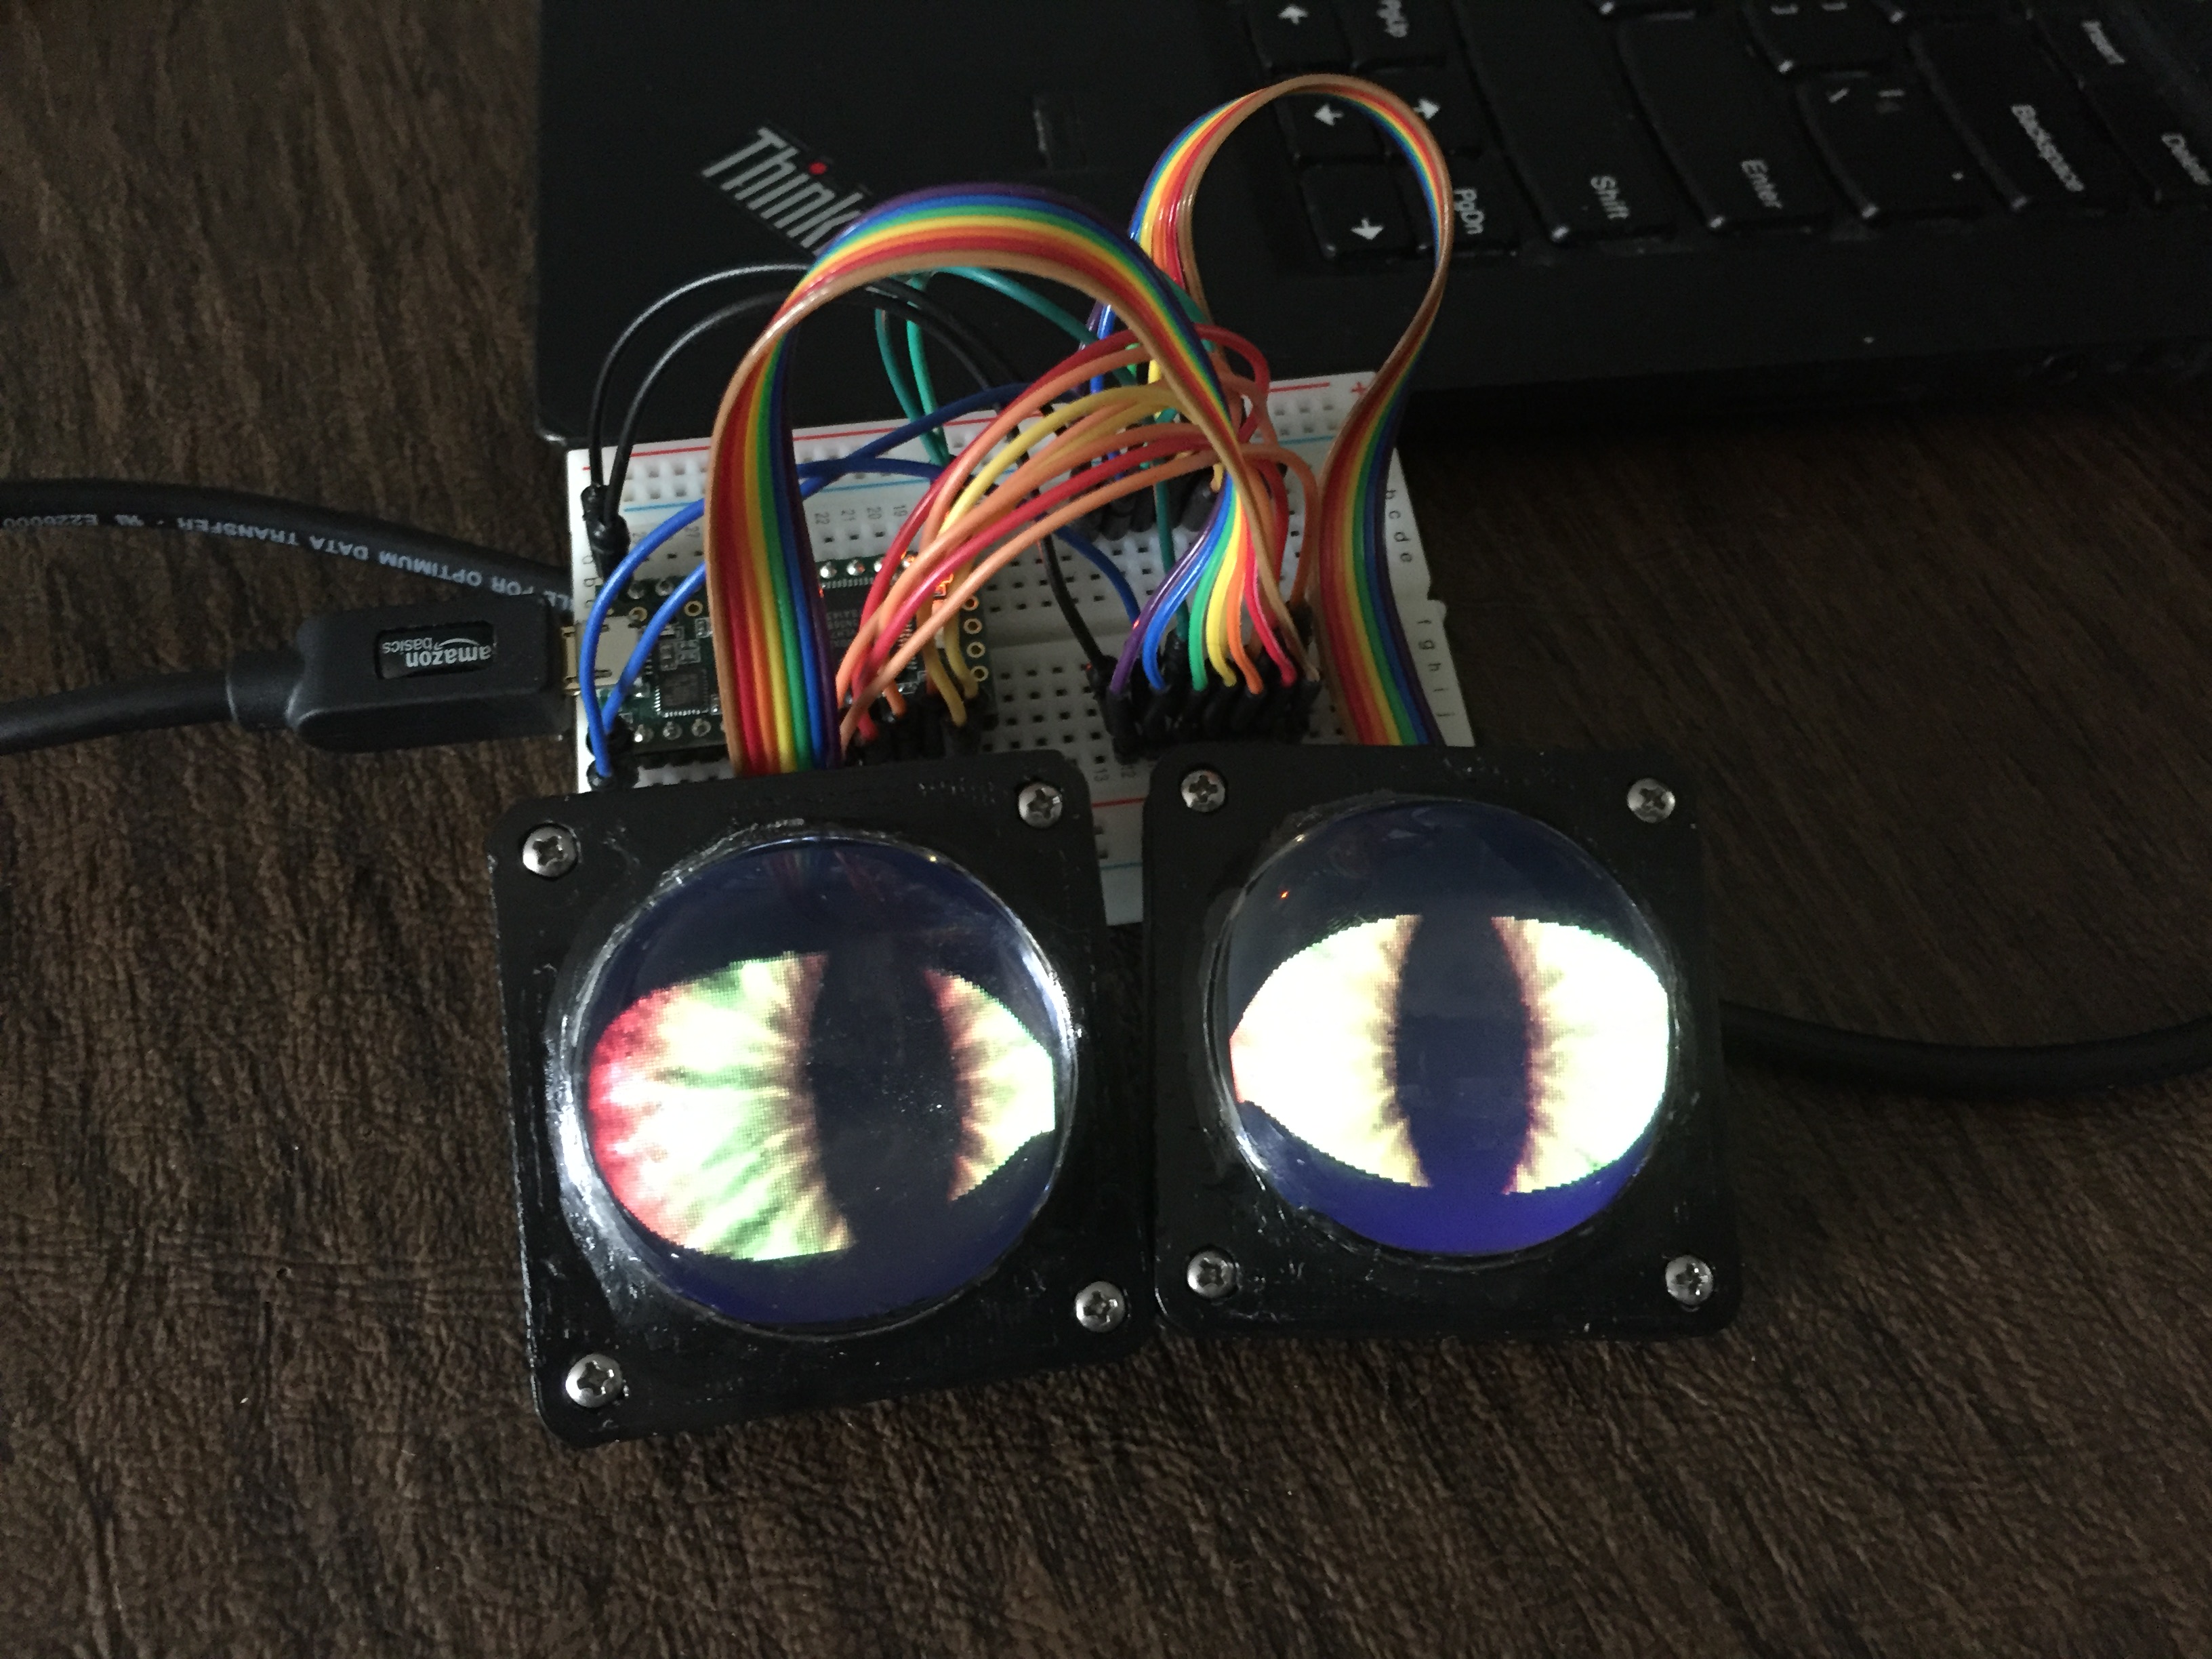
Wiring is shown below:
3-D Printed Holder:
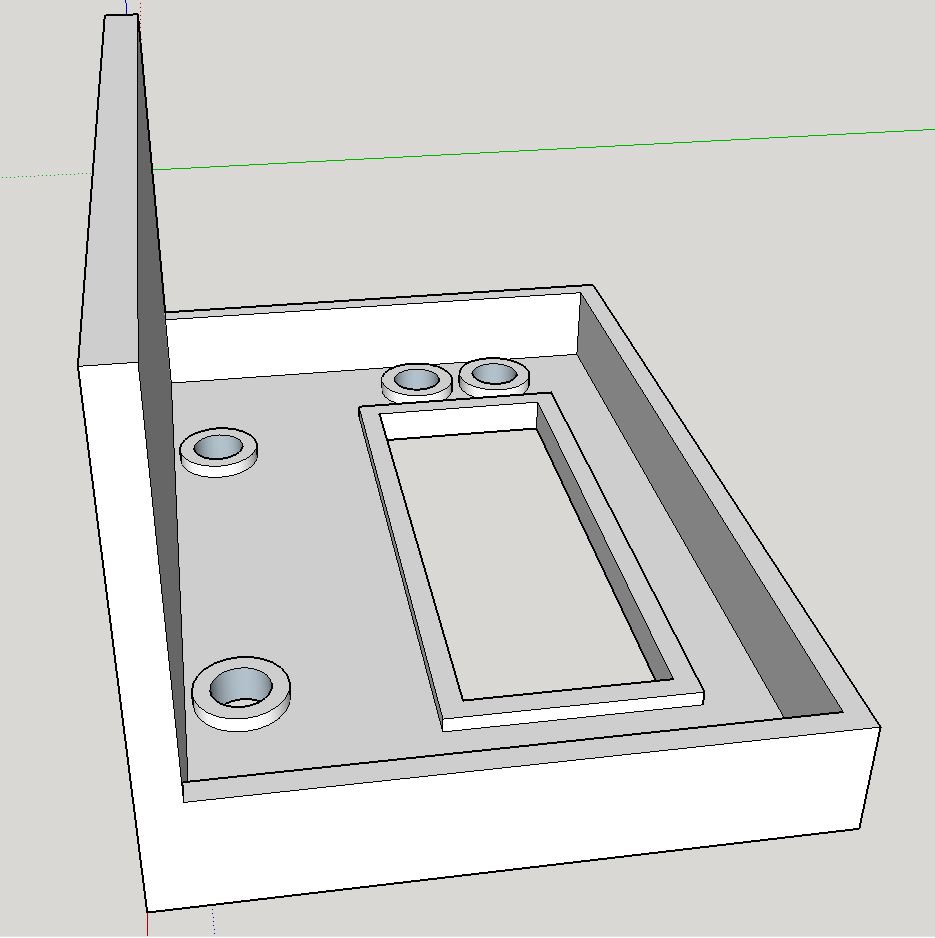
The holder keeps the 7-Segment LED in place and, though it is open, hides the electronics behind the display when viewed from the front.
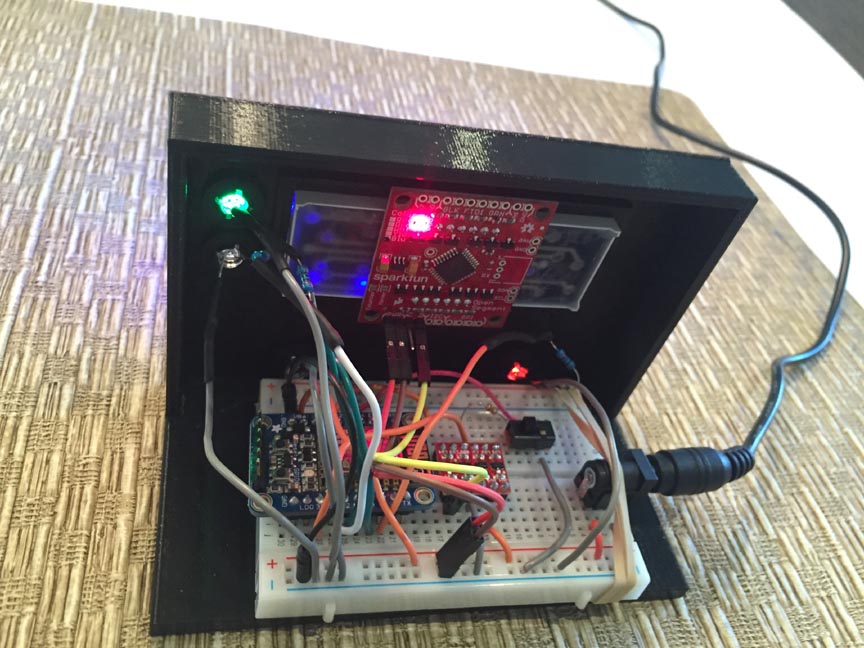
Assembly:
Assembly is very straightforward. Wire up the electronics on the breadboard. I soldered the 220 Ω resistors directly to the positive legs of the LEDs to keep wiring simpler. Then stick the breadboard to the back platform of the stand, and push the holders through the holes in the front. Then push the LEDs into the holders. The 7-segment LED display fits inside the rectangular hole in the front. I didn’t even have to glue it into place. A rubber band helped secure a barrel-jack connector to the breadboard to transmit power from the 6V wall adapter.
Software
Overview:
Rather than have the Arduino-based code running on the Huzzah pull all the data off of the web page then parse the text, it is much easier to break up the software into two separate components. The first component, running on a Raspberry Pi, pulls the data from the FiveThirtyEight page and extracts the numbers we’re interested in using Node-Red – a Javacript based tool which allows drag-and-drop interfacing of APIs, online services and hardware. The second component is the Arduino-based code running on the Huzzah which controls the hardware and receives polling data over WiFi through the ESP8266 contained in the Huzzah. The components communicate with each other through a mosquitto MQTT broker running on the Rapsberry Pi.
Raspberry Pi:
The combination of mosquitto and Node-RED running on a Raspberry Pi makes it easy to get information from the web to an IoT connected device. Mosquitto is an open-source MQTT message broker which receives and sends out lightweight messages on a publish/subscribe model. Node-RED is a Javascript-based tool which allows drag-and-drop interfacing of APIs, online services and hardware.
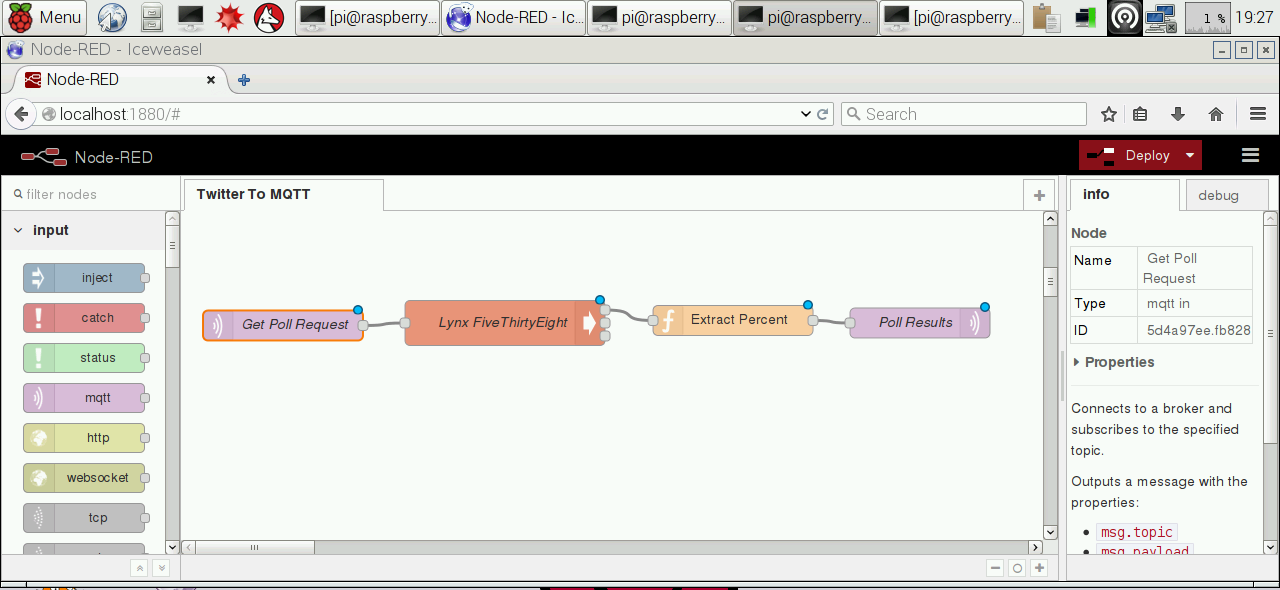
The Node-RED flow I used is shown above. The flow is triggered by the receipt of an MQTT message from the Apocalyptometer. The first node subscribes to an MQTT topic (‘polls/get’) and waits for a message to trigger the subsequent nodes in the flow. The second node runs a system command on the Raspberry pi to get the FiveThirtyEight.com data using Lynx, a text-based web browser. I tried using Node-RED’s HTTP node in the flow to grab the data from the website, but it didn’t work well with the FiveThirtyEight’s complex formatting. The FiveThirtyEight text data from Lynx then runs through the third node – a Javascript function to parse the text and extract the percentage chance of winning assigned to each party. The final node sends the output data in an MQTT message by publishing to the topic ‘polls/current’. The code running on the Huzzah subscribes to the same topic and receives each message as it is published.
Adafruit Huzzah:
The Arduino code is available at https://github.com/geekmomprojects/apocalyptometer and uses the Adafruit MQTT library to connect to the MQTT server, publish to the ‘polls/get’ topic and subscribe to the ‘polls/current’ library. I based this code off of one of the examples that comes with the library.
Possible Improvements
I’ve contemplate adding an alarm (loud, klaxon-type) to indicate when my preferred party’s support drops below a certain level, or visual cues on how the race is going (e.g. panic/don’t panic display).
I’d like to see what % of people would prefer “random American citizen.”